By JAN LARSON McLAUGHLIN
BG Independent News
There are few items that all sides in the Bowling Green City Schools’ funding dilemma agree on, except this – the district is being seriously shortchanged by the state.
That theory was emphasized again Saturday during a school board workshop on levy funding.
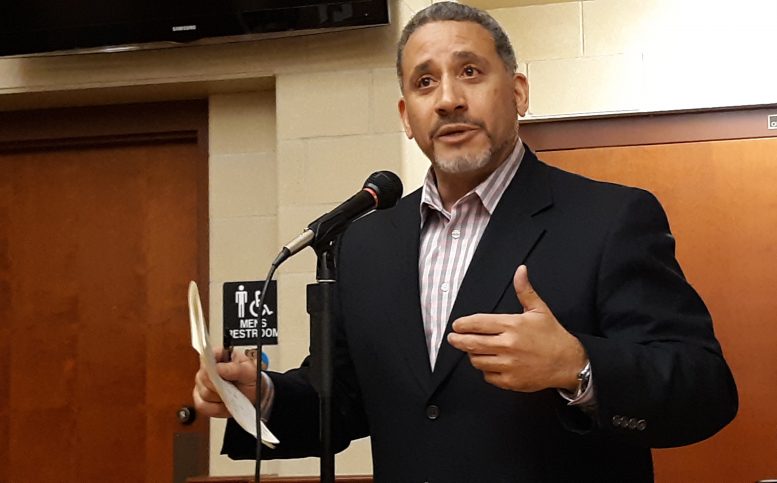
David Conley, a consultant with Rockmill Financial Inc., showed the board just how messed up the state’s formula is for determining a school district’s wealth.
The state lists Bowling Green as the 101st wealthiest out of 612 districts in the state. Based on local property values, divided by the number of students, the district has an average value per pupil of $213,005.
That “faulty” formula therefore ranks Bowling Green as wealthier than some districts recognized for their richness – Worthington, New Albany, Olentangy, Avon, Springboro and Shaker Heights. Locally, that formula assigns BG as a wealthier district than Ottawa Hills, Perrysburg and Sylvania.
“We receive less per student than Ottawa Hills,” board member Norm Geer said.
“If they were to build a school building, they would get more money than us,” Superintendent Francis Scruci said.
Conley concurred. Operating funds from the state average 44 percent of district operating expenses. In Bowling Green’s case, that is 32 percent.
Not taken into consideration is the fact that Bowling Green’s district is huge – about the size of the city of Pittsburgh, Conley said. It contains Bowling Green State University, which is exempt from property taxes, and a large area of fertile farmland.
Fighting the state is futile
The district can dispute its ranking – but that is unlikely to do anything other than waste time, Conley said.
“This is what we have. We’re living with it and doing our best,” Conley said voters need to realize.
So based on the current state funding formula, someone will suffer. It will either be the taxpayers who are being asked to foot more of the bill than they should be – or students who will not benefit from new or renovated schools and operating budgets.
Of course, there are multiple ways to view this situation, Conley said. And voters need to set their priorities.
“People pay more as a percentage of their income for their cell phone bills than they do for their school districts,” he said. The same can be said of spending on Netflix, he added.
And districts that delay action never end up saving money, Conley said.
“The reality is that almost everything you’re faced with isn’t going to get less expensive,” he said.
And then of course, there’s the reason for all these meetings and endless discussions.
“There are kids behind this picture,” he said.
What is affordable?
Of 16 school districts in this region, Bowling Green now sits at number 6 in terms of the affordability of its income tax. Right now the district has a 0.5 percent income tax, which averages 3.6 percent of local residents’ incomes.
The district is even lower, number 5 out of 16, in terms of its current property tax rate.
However, if Bowling Green succeeded in funding new or renovated school buildings as being suggested by the district’s facilities task force, then the “affordability” jumps as high as 15 out of the 16 area school districts.
By the numbers….
To get a handle on the district’s current situation, Conley presented the following numbers:
- The median home value in the district is $161,300.
- The median annual family income is $66,215.
- The current property tax rate is 27.2 percent, pulling in a median property tax of $1,535 per home.
- The current income tax rate of 0.5 percent collects an average of $331 per household.
- This adds up to an average of $1,886 per year, per household for the district.
At those rates, Bowling Green gets less funding per household than most districts in the region. Getting more money from their taxpayers are North Baltimore, Eastwood, Oregon, Otsego, Northwood, Rossford and Perrysburg. The only districts that get less than BG are Toledo, Lake, Elmwood and Washington Local.
The question, Conley said, is what does the Bowling Green community want from its schools.
Many of the districts spending more on schools already have new buildings.
“We do not,” he said.
Many have already passed new operating levies.
“We have not,” he said, noting that Bowling Green has not asked voters for new operating funds for nine years.
Balancing act ….
All districts rely on property taxes. Some also depend on income taxes. Of local districts with income taxes, the following percentage of residents’ incomes goes to schools:
- 2.5 percent in Lake.
- 2.57 percent in Elmwood.
- 2.78 percent in Otsego.
- 2.79 percent in Eastwood.
- 2.8 percent in Bowling Green.
Eight neighboring school districts don’t use income tax at all.
But some owners of farmland in the Bowling Green district have been unwavering in their opposition to footing more of the bill for the school district. So the school board and the finance task force are looking at ways to fund the district and building expenses using a balance of both property and income tax.
Making the situation more difficult is the fact that 81 percent of the district population makes less than $75,000 a year. A big portion of that is due to the BGSU student population.
So the district needs to determine – who can afford to pay more – and how much can those people afford.
Differences between property and income taxes
Property taxes are paid by every landowner – whether individuals or businesses.
Income taxes are paid only by individuals. Since businesses don’t pay, that already cuts 33 percent of the potential payers out of the picture.
If the district were to go with an earned income tax, rather than a traditional income tax, that would cut out another portion of the older population. So about 50 percent of the taxpayers (no businesses and no seniors) would be footing the bill.
The question then becomes, does the district want a tax that is equal for all – or one that is equitable for all. Should everyone be paying the same – or should those taxpayers with more be paying more?
What are the options?
So the school facilities task force has come up with a few top scenarios for new or renovated buildings. The estimated costs start as high as $41 million. So on Saturday, Conley plugged in a series of numbers showing various funding options.
- As a property tax:
- If $41 million was funded with a property tax, it would take 3.21 mills for 37 years, costing the average homeowner $181 per year.
- If the length of the bonds was shortened to 30 years, it would take 3.6 mills, costing $203 a year.
- If the length was shortened to 28 years, it would take 3.75 mills, costing $211 a year.
- As a traditional income tax:
- For a $41 million project funded by a traditional income tax, it would require another 0.5 percent income tax for 28 years, costing the average household about $331 a year.
- As an earned income tax:
- For the same $41 million project, but instead funded by an earned income tax, it would require another 0.75 percent income tax, over 30 years, costing the average household $662 a year.
Conley also plugged in numbers for a smaller $35 million facilities plan.
- As a property tax:
- If $35 million was funded with a property tax, it would take 3.07 mills for 30 years, costing $173 a year. If the time was extended to 37 years, it would take 2.74 mills and cost $155 a year.
- As a traditional income tax:
- Since the state only allows income taxes to be raised in increments of 0.25 percent, this scenario would also require an additional 0.5 percent income tax, costing $331 a year.
Since it also takes money to operate those new or renovated buildings, the district will need new operating funds, Conley said. If the buildings were funded by income tax revenue, and the operating monies come from property taxes, that could end up costing the average household $659 a year.

