By JAN LARSON McLAUGHLIN
BG Independent News
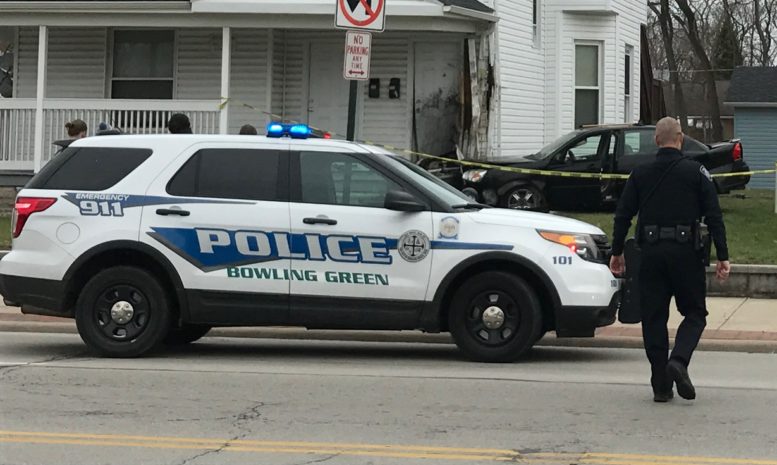
COVID is being credited for curbing car crashes in Bowling Green last year.
A total of 376 vehicle crashes were reported to Bowling Green Police Division in 2020. That’s 508 fewer than the 884 crashes reported in 2019.
“We would like to say that people are paying more attention and slowing down,” Major Justin White said of the drastic drop in crashes in 2020. “But it seems to be COVID.”
BGSU students heading back to their hometowns and people following orders to stay at home seem to have kept the streets more clear of collisions.
The police division’s annual analysis of vehicle crashes found that the high crash areas in the city shifted last year from Main Street to East Wooster Street.
And left turns into oncoming traffic seem to have been the culprit in many crashes.
The police division looks at three solutions to crashes – enforcement, education and engineering.
Enforcement, as most motorists know, are warnings or citations for bad driving behavior. Engineering is using signage such as “no left turn” or the placement of medians to try to stop crashes from occurring, White said.
For the police division, speed enforcement is used to deter crashes.
“Speed is a direct factor” in most crashes, White said. “A lot of times you’ll see a correlation between speed and accidents. If we stop more people for speed, we’ll have less accidents.”
So when the annual crash analysis identifies high crash areas, “we want to be visible in those areas,” White said.
Distracted driving continues to be a problem, White said. But unlike speeding, police cannot stop motorists just because they are texting while driving. However, if a crash occurs, police often subpoena the driver’s phone records to see if they were distracted while driving.
“You see it all the time,” White said.
While the number of crashes dropped, the number of OVI citations increased from 184 in 2019 to 185 in 2020.
“I was a little bit surprised by that,” White said.
The police division compiles data on motor vehicle crashes in the city each year to identify potential patterns or trends that may indicate enforcement, engineering or education needs.
This analysis looks at the location, time and day of the week to get a clear picture of trends and provide actionable data that officers on the street can use to mitigate traffic crashes and contributing circumstances.
Of the 376 crashes last year, 235 or 62.5% were not at intersections, while 137 or 36.43% occurred within an intersection. Four crashes were at a roundabout.
There was one fatal crash in 2020. There were 45 injury crashes representing 11.96% of the reported crashes.
The top crash areas identified by the analysis are East Wooster and Campbell Hill Road, East Wooster at Interstate 75, and the 1500 block of East Wooster Street.
Based on the analysis provided, it was recommended that patrol supervisors continue to use this data to deploy officers based on the days and times as well as locations that traffic crashes regularly occur. Officers are advised to look for distracted driving violations while investigating crashes.
Following are some of the 2020 crash statistics gathered by Bowling Green Police Division. Of the 376 crashes in the city:
- 288 took place during dry road conditions, 64 were during wet conditions, 11 were in snow, four on ice, and one was on dirt, oil or gravel.
- The largest number of crashes occurred between the hours of noon and 6 p.m., with 3 p.m. having the greatest number.
- The heaviest months for car crashes were September and October.
- The busiest days for crashes were Thursday and Friday.
- The most common objects struck in car crashes – aside from other vehicles – were utility poles, followed by traffic sign posts.
- The most common contributing circumstance for crashes was following another vehicle too closely in 105 instances, followed by failure to yield in 90 crashes, and improper backing in 29 incidents.
- Alcohol was involved in 12 crashes.
- The age range with the most crashes is 20-24 years old. Those ages were credited with 106 of the crashes last year.
- The vast majority of the crashes (321) occurred at speeds under 15 mph.