By JAN LARSON McLAUGHLIN
BG Independent News
A survey of Bowling Green residents shows that while many would like to see street infrastructure for bicyclists, few want to give up on-street parking, two-way streets, or portions of their front yards for those accommodations.
Surveys were mailed out to 2,080 Bowling Green residents. A total of 367 were returned, which is a typical 18% response rate, according to Emma Snyder and Estee Miller, who conducted the survey as part of their master’s in BGSU Public Administration capstone course.
Of those who responded, 45% were 61 years and older, 24% were between 46 and 60 years old, 18% were 31 to 45, and 13% were between 18-30.
Snyder and Miller presented their findings Monday evening to City Council.
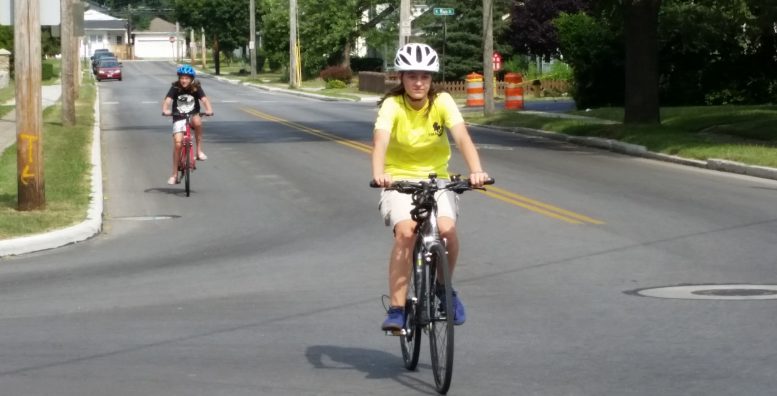
The survey shows that the main reasons people ride bicycles in the city are for exercise and fun. Most residents said they feel comfortable riding bicycles through the city.
The top three suggestions for making bicycling more safe and comfortable in Bowling Green were physically separated bike lanes, multi-use paths, and on-street painted bike lanes.
However, when it came to residents giving up their on-street parking, two-way traffic, and front yard space for those accommodations, many were not supportive.
Following are some of the most common survey responses:
- The main reason people don’t ride bikes is their preference to get around another way or walk.
- 68% feel safe and comfortable riding their bikes in Bowling Green.
- 55% said they would bicycle more often if they felt more safe/comfortable.
- 48% said they would support a tax levy for bike infrastructure.
- 40% said they were opposed to losing on-street parking to make room for bike infrastructure.
- 54% were against their streets becoming one-way to make room for bike lanes.
- 52% were against losing part of their yards to make room for bikes.
How often do you ride a bicycle?
- 105 rarely or never.
- 104 several times a week in the summer.
- 56 once a week in the summer.
- 21 several times a week year-round.
Why don’t you ride bike in Bowling Green?
- 58 prefer to get around another way.
- 42 prefer to walk.
- 32 said it’s too dangerous.
Where do you typically ride?
- 212 on streets in neighborhoods.
- 187 on Slippery Elm Trail.
- 160 on streets to destinations.
- 99 on sidewalks to destinations.
- 96 in city parks.
- 76 on sidewalks in neighborhood.
What streets do you avoid when riding bike?
- North Main Street.
- South Main Street.
- West Wooster Street.
- East Wooster Street.
- West Poe Road.
- East Poe Road.
- Haskins Road
- North Wintergarden Road.
- South Wintergarden Road.
- Sand Ridge Road.
- Pearl Street.
Are there places you would ride if you felt more comfortable?
- North Main Street.
- South Main Street.
- East Wooster Street.
- West Wooster Street.
Preferred choice to make bicycling easier on busy roads:
- 85% said bike lanes separated from traffic.
- 3% each for multi-use bike paths, on-street painted bike lanes, sharrows, and “bikes may use full lane” signage.
Preferred choice to make bicycling easier on quiet secondary neighborhood streets:
- 27% on-street painted bike lanes.
- 23% multi-use bike paths.
- 20% bike lanes separated from traffic.
- 12% sharrows.
- 12% nothing.
- 6% “bikes may use full lane” signage.
What should be done to make bicycling safer?
- 224 said bike lanes that are physically separated from vehicular traffic.
- 215 said bike/multi-use paths.
- 184 said on-street painted bike lanes.
- 113 said improve connectivity on high speed and busy streets.
- 85 said more motorist outreach/public bicycling awareness.
- 83 said low speed neighborhood routes with signs to destinations.
- 68 said more bicycling education for general public and bicyclists.